Class Profile
Our community is shaped by our students, making it a dynamic learning environment. Below is a snapshot of the Wharton MBA Class of 2017. Take a second to get to know them – and if you want to know more, come and visit us on campus.
Wharton MBA Class of 2017

Previous Industry Experience
Class Ranges & Averages
Class of 2017
| Applications | 6,590 |
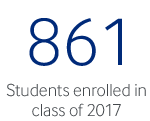
| Students Enrolled | 861 |
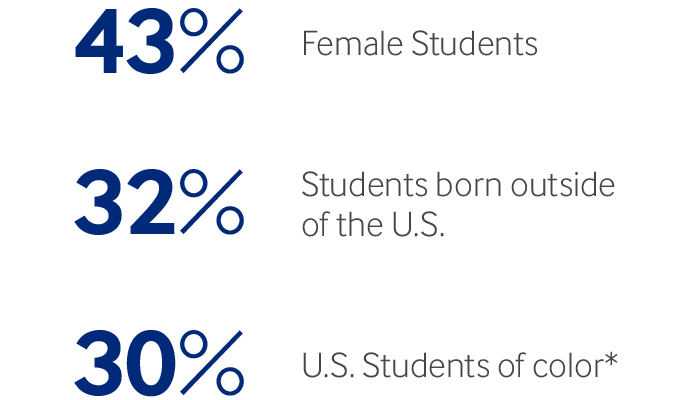
| Female | 43% |
| U.S. Students of Color* | 30% |
| Students born outside of the U.S. | 32% |
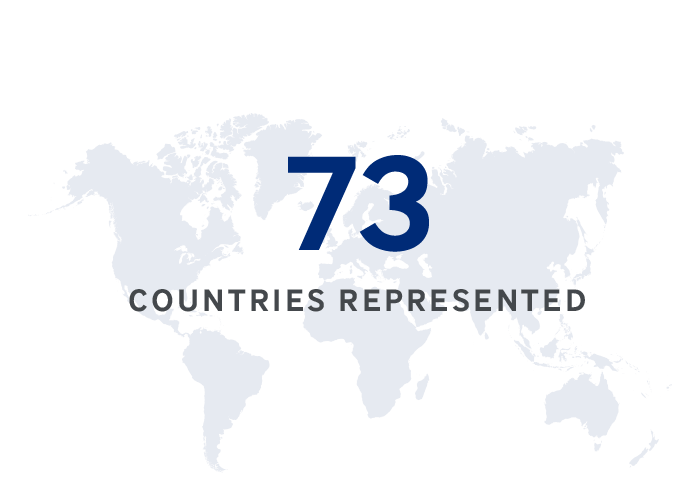
| Countries represented | 73 |
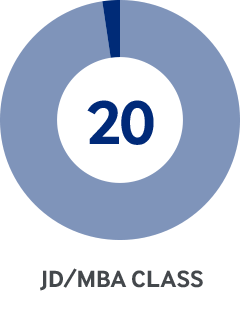
| JD/MBA Students | 20 |
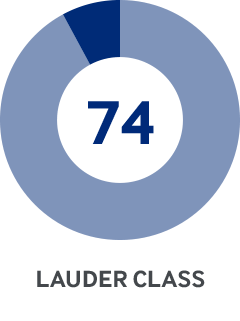
| Lauder Students | 74 |
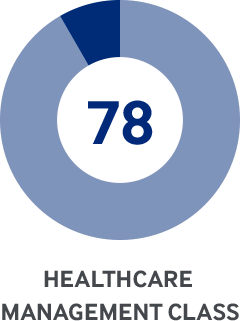
| Health Care Management Students | 78 |
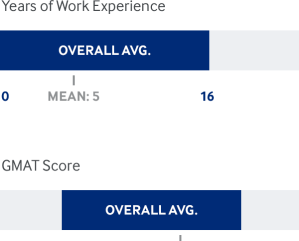
| Years of Work Experience | 5 |
| GMAT Score Median | 730 |
| GMAT Middle 80% Range | 700-770 |
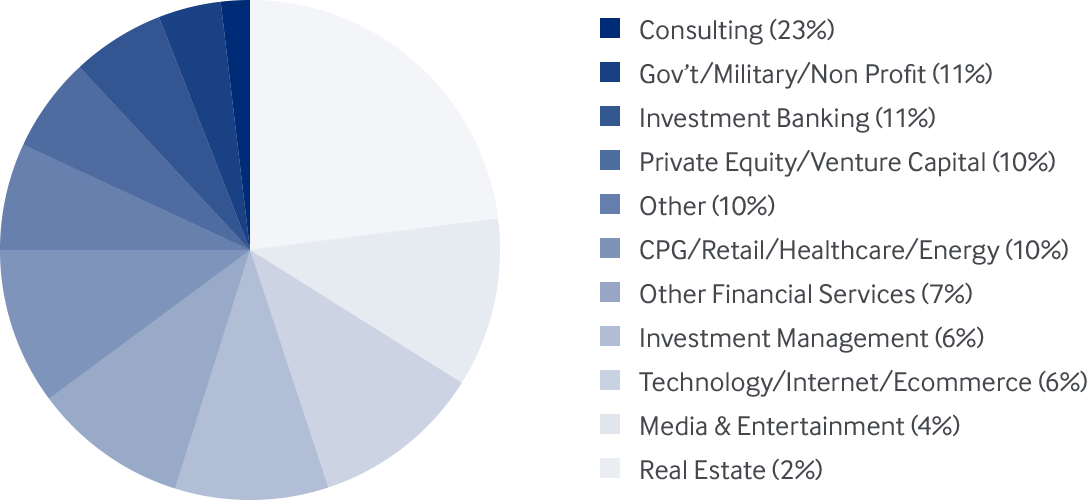
Previous Industry Experience
| Consulting | 23% |
| Government/Military/Non Profit | 11% |
| Investment Banking | 11% |
| Private Equity/Venture Capital | 10% |
| Other | 10% |
| CPG/Retail/Healthcare/Energy | 10% |
| Other Financial Services | 7% |
| Investment Management | 6% |
| Technology/Internet/E-commerce | 6% |
| Media and Entertainment | 4% |
| Real Estate | 2% |
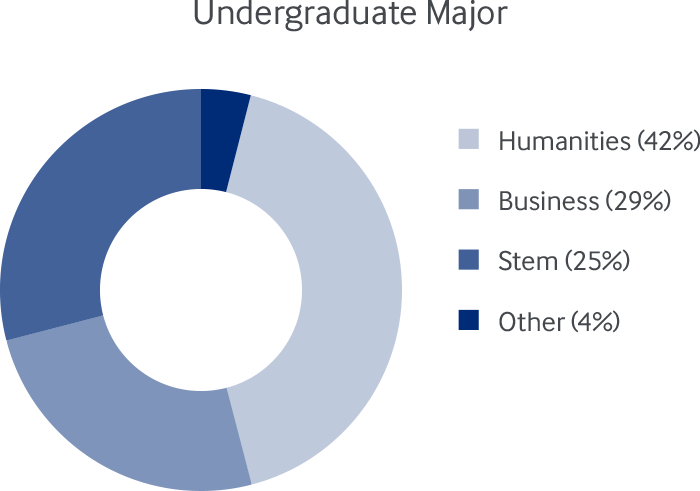
Undergraduate Major
| Humanities | 42% |
| Business | 29% |
| STEM | 25% |
| Other | 4% |
* Students of African-American, Asian-American, Hispanic-American, Native-American/Alaska Native, Native Hawaiian descent, and multiethnic backgrounds.
Note: Profile as of August 14, 2015


